Runtime Debugger
Runtime Debugger
The Runtime Debugger is a powerful development tool built into the Play Window that helps you inspect and monitor your story's execution in real-time.
Overview
The Runtime Debugger provides visibility into the internal state of your interactive story as it runs. You can watch variables change, track which script is executing, monitor the call stack when using nested scripts, and verify that your branching logic works as expected.
Development Tool Only
The debugger is only available when testing your story from the editor's Play Window. It is automatically hidden in exported HTML games to keep your published stories clean and performant.
What you can do with the debugger:
- Monitor local and global variable values in real-time
- Track which script file is currently executing
- View the call stack when using Run Script nodes
- Verify that variables are being set correctly
- Debug conditional branching logic
- Troubleshoot story flow issues
Accessing the Debugger
The debugger is built directly into the Play Window and can be toggled on or off while testing your story.
Opening the Debugger
- Start testing: Click the Play button (▶) in the editor's top toolbar, or press F5
- Locate the debug icon: Look for the bug icon button in the top-right corner of the Play Window
- Click to toggle: Click the bug icon to open the debug panel
- Close when done: Click the X button in the panel header to close it
Tip: Quick Access
You can open and close the debugger at any time during testing without interrupting your story. This makes it easy to check variable values at specific moments in your narrative.
Debugger Interface
The debug panel appears as an overlay in the top-right corner of the Play Window. It has a dark, semi-transparent background and displays multiple sections of debugging information.
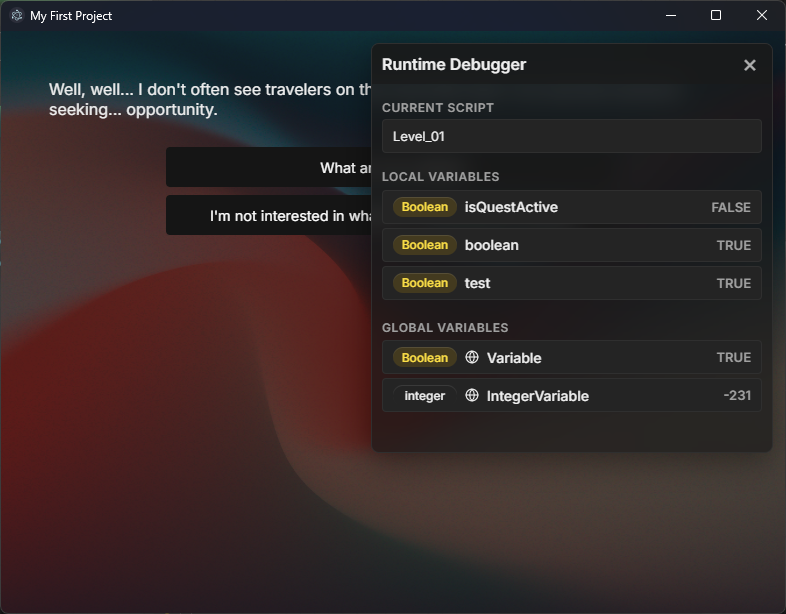
Panel Layout
The debugger is organized into several collapsible sections, each showing different aspects of your story's state:
1. Current Script
Shows the name of the script file (.sfe) that is currently executing. This is especially useful when you have multiple scripts in your project and want to verify which one is active.
- Display: Shows the filename without the
.sfeextension - Tooltip: Hover over the name to see the full file path
- Example: If executing
Chapter1/intro.sfe, displays "intro"
2. Call Stack
Displays the hierarchy of nested script calls when you use Run Script nodes. The call stack shows you which scripts called which, helping you understand the execution flow when stories get complex.
- When visible: Only appears when you're inside a script that was called by another script
- Stack order: Most recent call appears at the top
- Maximum depth: StoryFlow supports up to 20 levels of nested calls
- Example: If MainMenu calls ShopSystem, and ShopSystem calls ItemDetails, the stack shows both parent scripts
Call Stack Behavior
When a script reaches an End node, it returns to the calling script. The call stack section disappears when you return to the top-level script (the one that wasn't called by another script).
3. Local Variables
Lists all variables defined in the current script. These variables are reset when you switch to a different script file.
Variable display format:
- Type badge: Colored pill showing Boolean or Integer
- Variable name: The name you gave the variable
- Current value: The variable's current value (updates in real-time)
Value formatting:
- Boolean: Displays as
TRUEorFALSE - Integer: Displays as a plain number, e.g.,
42
4. Global Variables
Lists all project-wide variables that persist across all scripts. Global variables are marked with a globe icon to distinguish them from local variables.
- Persistence: Global variables retain their values when switching between scripts
- Visibility: Changes made in one script are immediately visible in all other scripts
- Use case: Perfect for tracking player stats, story progress flags, and inventory
Debugging Features
Real-Time Variable Monitoring
The debugger automatically updates whenever your story's state changes. You can watch variables change in real-time as your story executes:
- When you click a dialogue option, variables update immediately
- Set Boolean and Set Integer nodes change values instantly
- Branch nodes evaluate conditions and you can see the input values
- Variables persist correctly across script boundaries (for globals)
Script Execution Tracking
The Current Script display helps you understand which part of your story is currently executing. This is crucial for complex projects with many script files organized into folders.
How it helps:
- Verify that Run Script nodes are calling the correct scripts
- Confirm you're in the expected script after making selections
- Debug issues where the wrong script is loading
- Track navigation through multi-chapter stories
Call Stack Visualization
When using Run Script nodes to create reusable systems (like shops, battles, or dialogue trees), the call stack shows the path of execution:
Example scenario:
- Player is in
Chapter2.sfe - Clicks "Visit Shop" which runs
ShopSystem.sfe - Buys a weapon which runs
ItemPurchase.sfe - Call stack shows:
Chapter2 → ShopSystem(ItemPurchaseis current) - When
ItemPurchaseends, returns toShopSystem - When
ShopSystemends, returns toChapter2
Debugging Nested Scripts
If your call stack shows unexpected scripts, it means a Run Script node is calling the wrong file. Check your Run Script node configurations to ensure they're pointing to the correct script files.
Common Debugging Scenarios
Scenario 1: Conditional Branch Not Working
Problem: Your Branch node is taking the wrong path, or a conditional dialogue option isn't appearing.
Debugging steps:
- Open the debugger and navigate to the point before the branch
- Check the Local Variables section for the boolean variable controlling the branch
- Verify the variable has the expected value (TRUE or FALSE)
- If the value is wrong, trace back to where it should have been set
- Check that your Set Boolean node is properly connected to the execution flow
Scenario 2: Variables Not Persisting
Problem: You set a variable in one script, but it's not available in another script.
Debugging steps:
- Check whether the variable is in Local Variables or Global Variables
- If it's in Local Variables, it won't persist when switching scripts
- To fix: Create the variable as a global variable in your project settings
- Verify the globe icon appears next to the variable in the debugger
- Test again and confirm the variable now persists across scripts
Local vs Global
Local variables are perfect for temporary state within a scene. Global variables should be used for player stats, quest progress, and anything that needs to persist throughout the entire story.
Scenario 3: Story Ends Unexpectedly
Problem: Your story ends when it shouldn't, or the Play Window closes too early.
Debugging steps:
- Open the debugger before the unexpected ending
- Check the Call Stack section
- If Call Stack is empty: An End node in your top-level script is closing the story
- If Call Stack has items: An End node is returning from a nested script (correct behavior)
- Review your node connections to find unintended End nodes
- Consider using Branch nodes to avoid dead ends
Scenario 4: Wrong Script Loading
Problem: A Run Script node loads the wrong script file.
Debugging steps:
- Make the selection that triggers the Run Script node
- Immediately check the Current Script display in the debugger
- If the wrong script is shown, the Run Script node has incorrect configuration
- Return to the editor and select the Run Script node
- Verify the script path in the node's properties panel
- Update the path and test again
Scenario 5: Integer Comparisons Failing
Problem: A Greater Than or Less Than node isn't working as expected.
Debugging steps:
- Open the debugger and locate the integer variables in Local or Global Variables
- Check the current values of both variables being compared
- Manually verify the comparison (e.g., is 5 > 3?)
- If values are correct but branch is wrong, check your comparison node connections
- Ensure the comparison output is connected to the Branch node's input
Tips & Best Practices
Keep the Debugger Open During Development
While building and testing your story, keep the debugger panel open so you can watch variables change in real-time. This helps you catch bugs immediately rather than after multiple playthroughs.
Use Descriptive Variable Names
In the debugger, variables are listed alphabetically by name. Using clear, descriptive names makes it much easier to find and monitor the variables you care about:
- Good: BooleanhasMetMerchant, BooleanquestChapter2Complete, IntegerplayerGold
- Bad: Integervar1, Booleanflag, Integerx
Test Edge Cases
Use the debugger to verify behavior in edge cases:
- What happens when an integer variable reaches 0 or negative values?
- What happens when a boolean is false at a critical decision point?
- What happens when you reach maximum call stack depth (20 levels)?
- What happens when you return to a script after calling multiple nested scripts?
Document Your Variables
While the debugger shows variable names and values, it doesn't show what each variable represents. Keep notes or use Comment nodes in your editor to document what each variable controls.
Check Variables After Set Nodes
If you suspect a Set Boolean or Set Integer node isn't working, advance your story one node past it and check the debugger. If the variable hasn't changed, the Set node might not be connected to the execution flow (primary handle).
Pro Tip: Systematic Testing
When debugging complex stories, test one path at a time with the debugger open. Make notes of what you expect to see for each variable, then compare with the actual debugger output. This systematic approach helps identify exactly where logic breaks down.
Monitor Global State Across Scripts
When working with global variables, test switching between multiple scripts while monitoring the Global Variables section. Verify that:
- Global variables persist their values when changing scripts
- Changes made in one script are visible in other scripts
- Global variables don't reset unexpectedly
Debugging Mastery
The Runtime Debugger is your best friend when building complex interactive stories. With practice, you'll be able to quickly identify and fix issues by watching variable changes and execution flow in real-time.